

24× Organic Growth, Year On Year
“In twelve months, organic search traffic grew 24× — from 5,534 sessions to 134,271 — with 632K engagement events across the quarter.”
Organic Sessions
134K
Organic Growth (YoY)
24×
Engagement Events
632K
About Tirupati Balaji Tours & Travels
Tirupati Balaji Tours & Travels runs one of South India's busiest pilgrimage-transport operations. From a base in Tirupati, they move families, tour groups and corporate parties to the Sri Venkateswara temple at Tirumala and onward across the region — Srikalahasti, Kanchipuram, Madurai, Srisailam and the Pancha Linga circuit — with a fleet that spans economy sedans to 50-seater coaches.
It is a demand-heavy, seasonal business. Darshan dates, festival calendars and last-minute cab bookings each spike at different times, and nearly every booking begins with a search. When our partnership began eighteen months ago, the brand had the fleet and the reputation to compete nationally — pan-India departures from Delhi, Pune, Vizag, Kerala and Coimbatore — but its website was not built to be found, nor to convert the people who found it.
The Strategy
We did not approach this as a one-off website refresh. We approached it as infrastructure. The brief we set ourselves on day one was a search architecture that could scale with the business — one that ranks a Delhi-to-Tirupati package as cleanly as a local Chennai airport transfer, without a person hand-building a new page every time a route was added.
Technical foundation first. Before any content work, we fixed what both search engines and users feel immediately: speed, crawlability and structure. We rebuilt the templates around Core Web Vitals, untangled the crawl paths so every package and route page could actually be discovered, and layered structured data — Trip, Service and FAQ schema — so listings earned richer, more clickable results.
A programmatic route map. Pilgrimage travel is a matrix: cities multiplied by temples multiplied by vehicle types. Rather than hand-write hundreds of near-identical pages, we built a data-driven system that generates a distinct, genuinely useful page for each route and package — each with its own pricing context, itinerary and local detail. That is what lets the site cover every departure city at once, and add the next one without re-engineering anything.
Then we let it compound. For eighteen months the work was deliberately unglamorous: monthly technical audits, faster templates, tighter internal linking, and patient coverage of the queries pilgrims actually type. None of it was a growth hack. It is the same system we deploy for clients in the UK and Singapore — the mechanics of capturing search demand do not change with the postcode.
The Results
The figures below compare a full quarter — 9 April to 7 July — against the exact same window a year earlier. A like-for-like, year-on-year read, not a seasonal blip:
Organic search sessions: 5,534 → 134,271 — a 2,326% increase, roughly 24× in twelve months.
Organic engagement events: 31,799 → 549,633 — up 1,628%, the clearest sign the new traffic was active and intent-led.
Total sessions: 15,961 → 155,114 (+872%), with organic search now driving 86.6% of every session — this brand's demand is compounding, and it's compounding through search.
Total engagement events: 90,753 → 632,411 (+597%) across all channels.
Two numbers moved the other way, and they should: average engagement time per session fell from 1m 25s to 41s, and engagement rate from 71.6% to 48.4%. That is the honest signature of scaling top-of-funnel by 24× — a vastly larger, broader, first-time audience naturally dilutes per-session averages even as total engagement multiplies seventeen-fold. Depth is the next phase: returning-visitor journeys and sharper landing pages to convert an audience this size.
The takeaway. This is what a year of disciplined technical SEO looks like on a like-for-like basis — not a one-month spike, but a 24× organic step-change that holds up when you compare season against matching season. Enterprises evaluating a partner should demand exactly this: year-on-year proof, not a cherry-picked window.
Services Rendered
Technologies & Tools
Frequently Asked Questions
Latest from the Blog
Insights, tips and stories on digital marketing

Mastering GEO in Bangalore: Boost AI Visibility
Explore how mastering GEO in Bangalore can elevate AI visibility, ensuring your B2B content gets cited by AI engines.
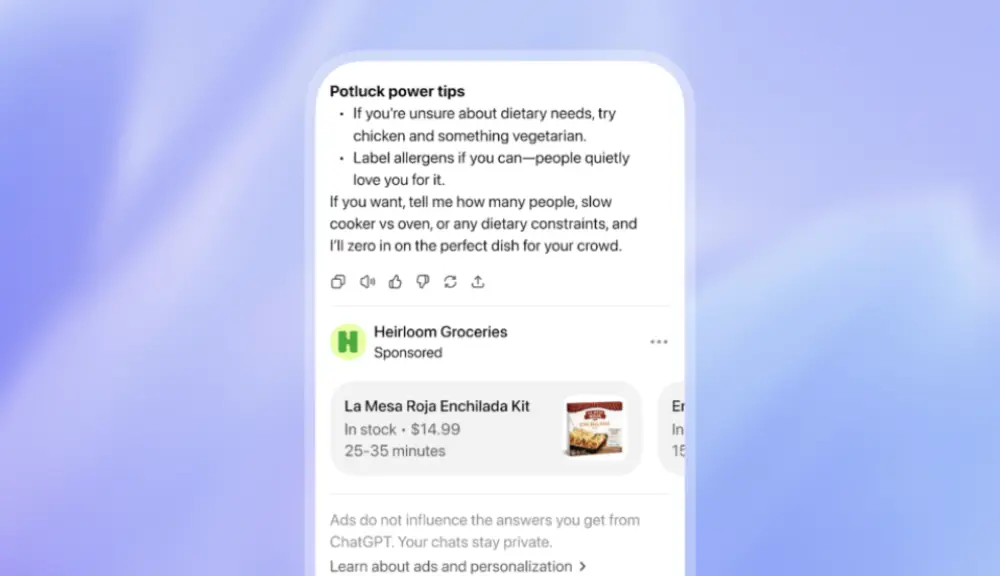
ChatGPT Ads Are Here: What OpenAI's Paid Layer Really Means for Your GEO Strategy
OpenAI is putting ads in ChatGPT — but they run on separate systems and can't influence answers. That one line reshapes your AI search budget. Here's the earned-vs-paid playbook for CMOs.

The 10 Best LLM Visibility Tools & SEO Analysis Software for 2026
In 2026, ranking #1 on Google is a vanity metric if your brand is invisible in the ChatGPT summary or missing from Perplexity’s answer carousel. The shift is seismic: 40% of commercial search queries now begin with AI as
Want Results Like These?
Get in touch with PivotM to scale your revenue, generate leads, and grow your ROI.